Mar 12, 2026
EW category 2025. Immigrant Visa (IV) Issuance data (Other Workers/Unskilled Workers) from January 2025 through August 2025.
EB3 Unskilled 2025 Approval (Data from January 2025 -August 2025)
HI AVA MIGRATION Reader.
I have reviewed the eight images provided, which contain the Immigrant Visa (IV) Issuance data for the EW category(Other Workers/Unskilled Workers) from January 2025 through August 2025.
Important Clarification on the Data
The documents provided are Visa Issuance reports from the Department of State, not USCIS Petition reports.
Issuances represent the final step: a person being granted a physical visa at a consulate.
Receipts, Denials, and Pending stats relate to the petition stage (Form I-140) at USCIS.
Because these reports only track successful "Issuances," they do not contain the number of denied applications, pending cases, or new receipts.
Below is the summary of the Visa Issuances (successful approvals) based on the documents provided.
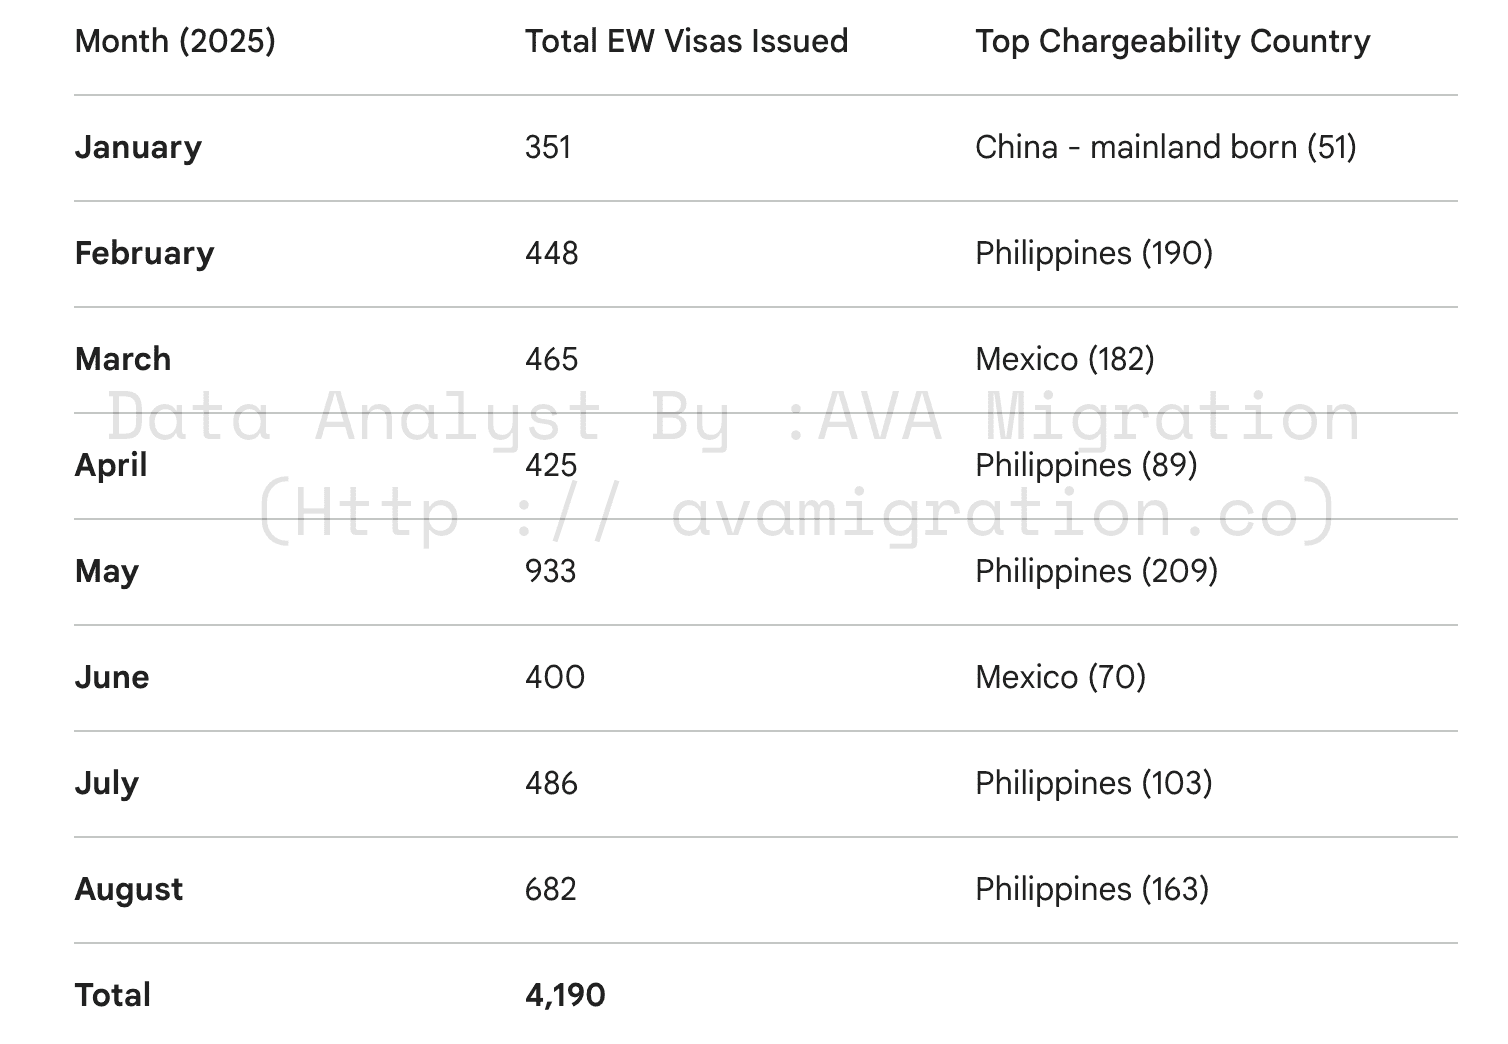
1. Data Summary: EW Visa Issuances (Jan – Aug 2025)
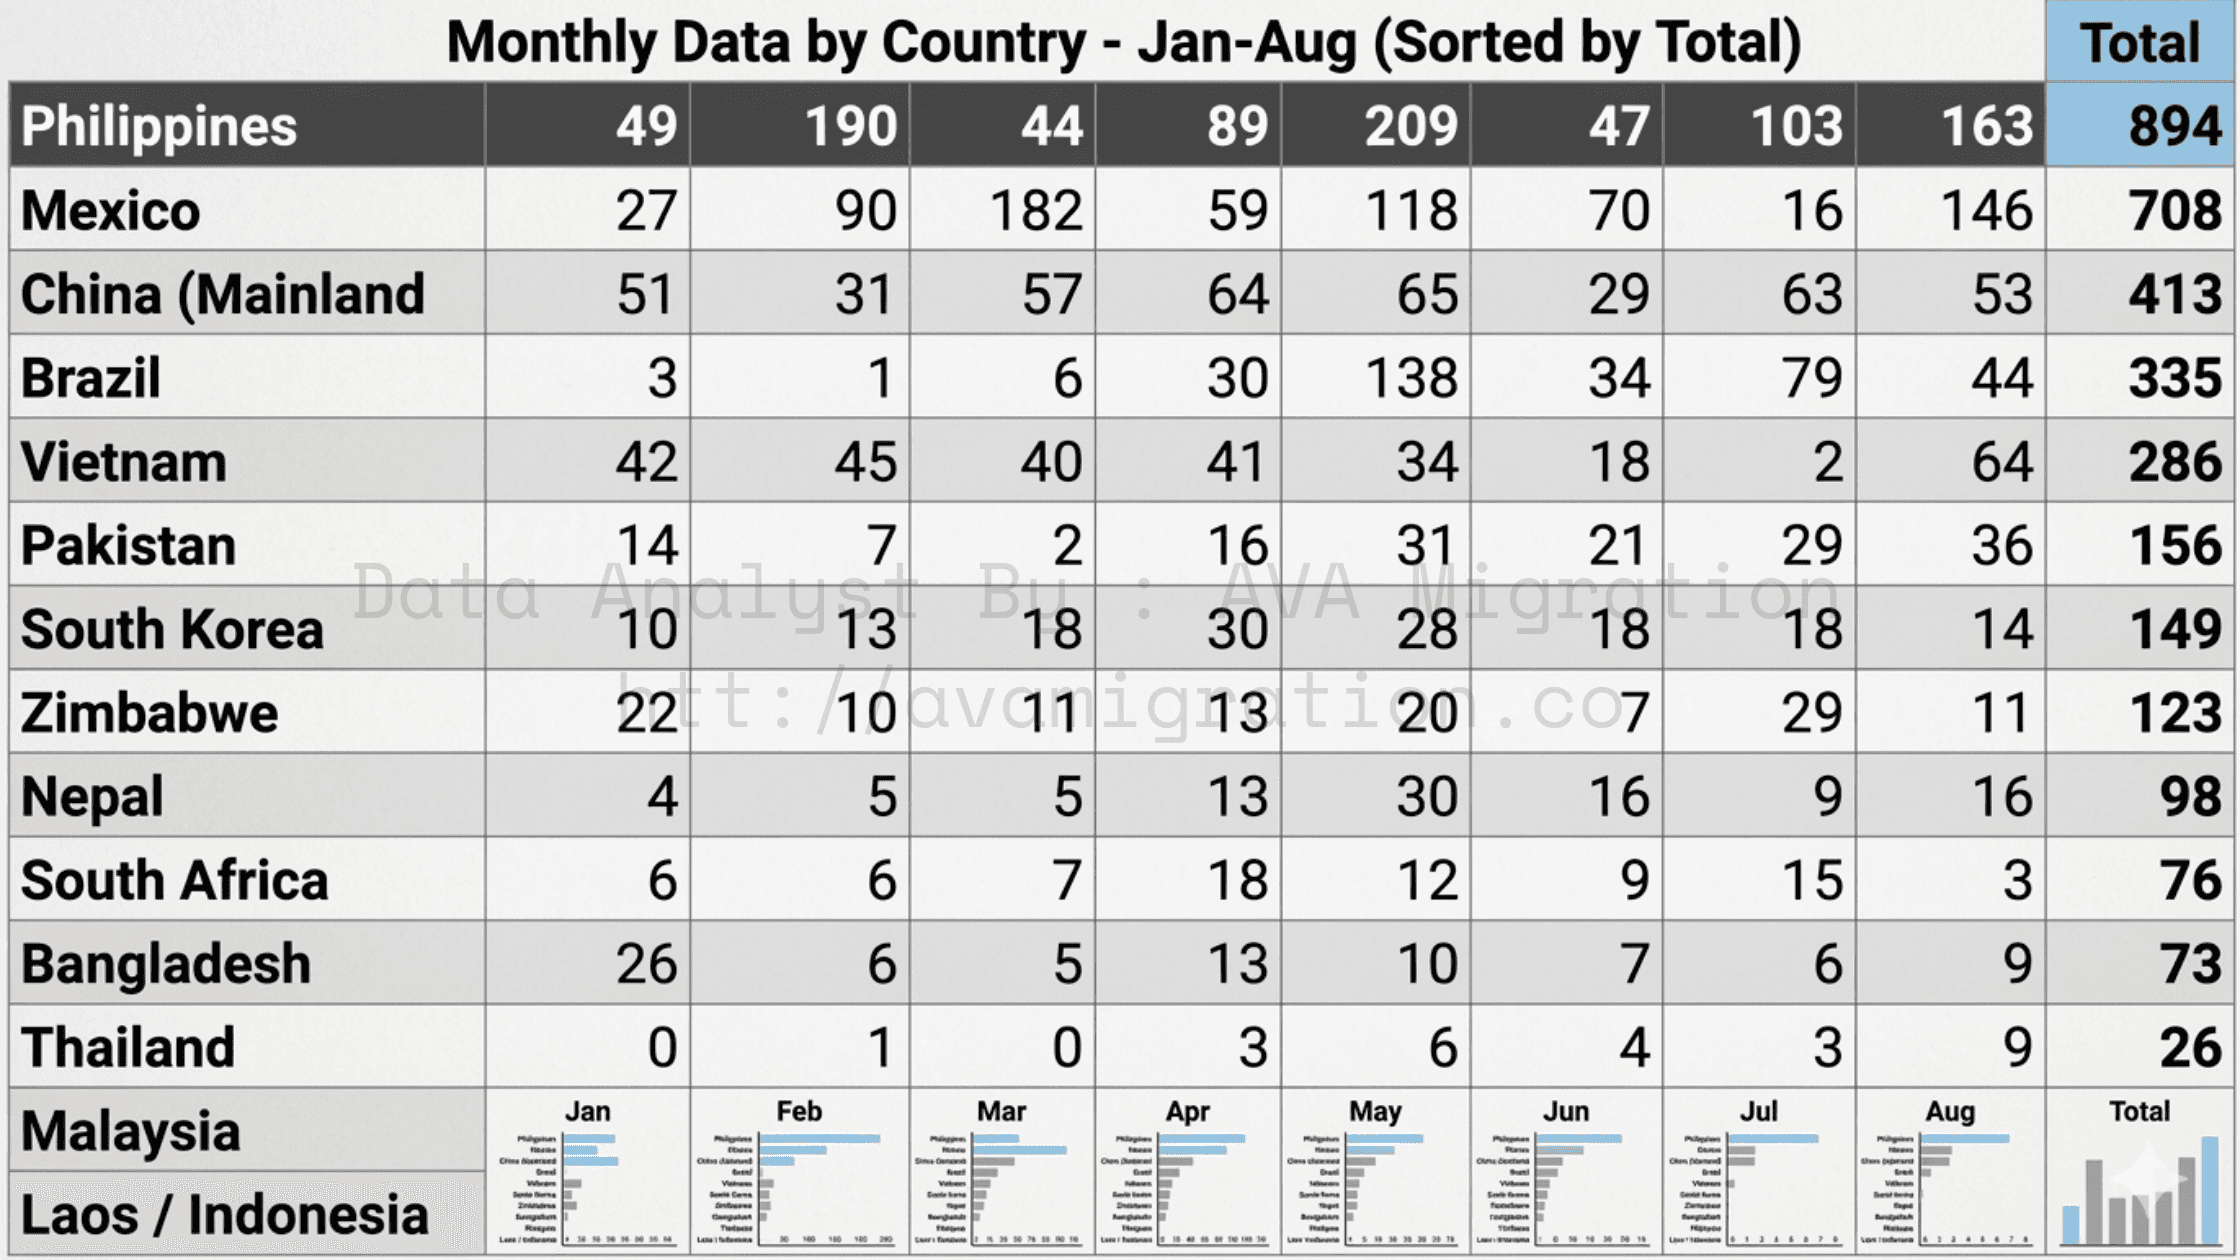
The following table summarizes the total successful visa issuances across all countries for the EW category
2. Approval Trend & Volume Analysis
Since the provided data only tracks successful issuances, we can visualize the monthly volume to see the fluctuation in consulate processing speeds.
Peak Volume: May 2025 saw a massive surge, with 933 visas issued, more than double the volume of the preceding and following months.
Consistent Leaders: The Philippines, Mexico, and China (Mainland) consistently accounted for the highest volume of issuances throughout the eight-month period.
Stability: Outside of the May spike, the average monthly issuance hovered around 400–450 visas.
3. Regional Distribution (Snapshot)
The data shows a heavy concentration of EW issuances in specific regions:
Southeast Asia: Driven largely by the Philippines and Vietnam.
North America: Driven by Mexico.
East Asia: Driven by Mainland China.
Note on "Approval Rates": In U.S. immigration statistics, the "Refusal Rate" for Immigrant Visas at consulates is generally very low compared to non-immigrant visas (like tourist visas), as the rigorous vetting happens at the USCIS petition stage before these files ever reach the consulate.
Based on the reports provided for January through August 2025, here is the detailed breakdown of immigrant visa issuances for the requested countries in the EW (Unskilled Worker) category.
1. Data Summary: EW Visa Issuances (Approvals)
As noted previously, these reports track successful visa issuances (approvals) at U.S. consulates. They do not contain data for "Receipts," "Denials," or "Pending" cases, which are handled by USCIS during the petition phase.
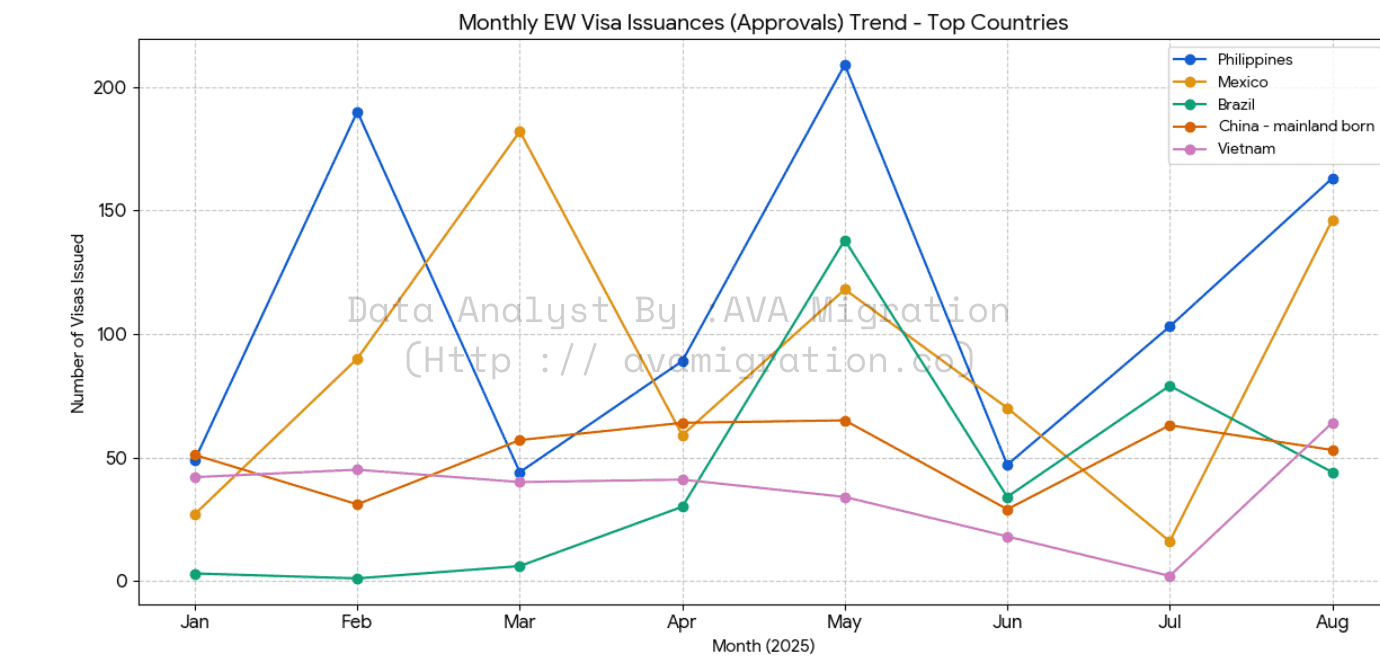
2. Issuance Trend Analysis
The trend chart below tracks the monthly fluctuations for the top five countries.
Philippines: Shows the highest volatility and the highest overall volume, peaking at 209 in May and 163 in August.
Mexico: Recorded a massive surge in March (182), likely due to a clearing of consular backlogs.
Brazil: Experienced a dramatic increase starting in April, reaching a peak of 138 in May.
Vietnam: Remained steady (avg ~40) before a significant drop in July (2), followed by a sharp recovery in August (64).
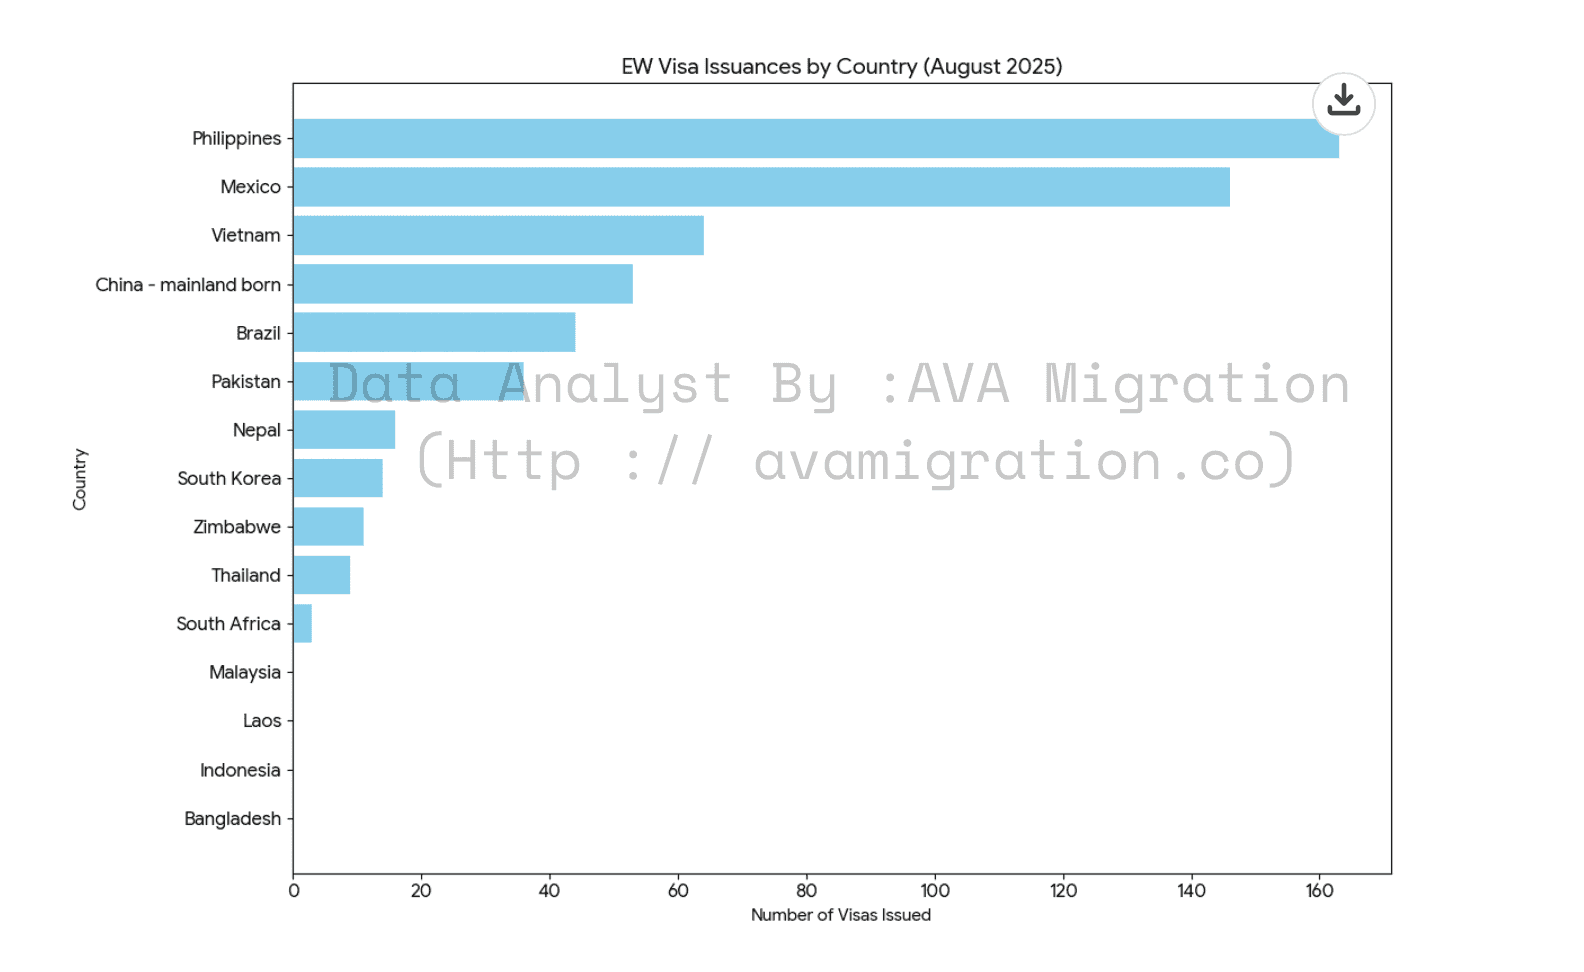
3. Volume Comparison (August 2025 Snapshot)
The bar chart below compares the total volume of successful approvals across the requested countries for the most recent month provided (August 2025).
Key Observations:
Concentration: The Philippines and Mexico alone account for a significant portion of the total EW visas issued globally.
May Peak: Almost all countries showed a notable increase in May 2025, suggesting a period of high efficiency or increased quota availability at the consulates.
Emerging Regions: While Thailand, Malaysia, Laos, and Indonesia have historically low numbers in this category, Pakistan and Nepal show a slow but steady upward trend in issuances.
Data Analyst by : Elizabeth Maruyama
Founder
America Visa Advisory
Email : Elizabeth@avamigration.co
Default